Manufacturers
Unify finance, supply chain, production and quality data without replacing the systems that run the business.

PACK BI unifies ERP, MES, CRM, databases and spreadsheets into governed metrics, interactive analytics, structured reports and controlled data collection — deployed in your own environment.
Unify finance, supply chain, production and quality data without replacing the systems that run the business.
Standardize KPI definitions and reporting across entities, business units and source systems.
Extend existing ERP projects with governed analytics, complex reporting and controlled data collection.
Move from source data to governed decisions without stitching together a separate warehouse tool, dashboard tool, reporting engine and spreadsheet workflow.
Configure dimensional models, reusable measures, refresh logic and lineage for a consistent analytical foundation.
Build and publish interactive analysis for web, mobile and large-screen operating views.
Design structured, cross-tab and free-form reports when management needs detail as well as visualization.
Bring spreadsheet-like manual inputs into governed forms, formulas, permissions and approval flows.
Organize refresh strategies, incremental extraction, job schedules and execution logs in one place.
PACK BI is strongest where operational questions cross systems, teams and reporting formats.
Finance · Supply chain · Production · Quality
Connect financial results to orders, inventory, production progress and quality signals across plants and business systems.
Discuss this use caseMulti-entity reporting · Governed KPIs · Drill-through
Create shared definitions across entities while preserving the ability to trace a group result back to its business origin.
Discuss this use caseProcurement · Inventory · Sales · Fulfillment
Follow materials and orders across purchasing, stock, sales and delivery instead of reconciling disconnected extracts.
Discuss this use casePACK BI is designed for organizations that need analytical control without moving core operational data into an unfamiliar public environment.
Run PACK BI in your own controlled environment.
Connect Oracle, MySQL, SQL Server, PostgreSQL, Hive, Vertica, ClickHouse, files and APIs.
Manage access by role, module, report, page, field, row and column.
A practical engagement starts with a real decision or reporting bottleneck, then works backward to the data and operating model it requires.
Map the systems, files, owners and refresh windows behind the decision.
Define reusable dimensions, measures, rules, permissions and lineage.
Deliver dashboards, operational reports and data-collection workflows.
Publish to the right roles and transfer the knowledge to maintain it.
Three anonymized manufacturing projects show how ERP, production, quality, spreadsheet, and reporting data were organized into governed decision flows.
Three independently accounted plants used separate U8 account sets, while historical and current data, OA, CRM, and shop-floor information sat in different places. Managers relied on repeated spreadsheet collection for cross-plant decisions.
Operational history accumulated in U9C, but key management data still had to be collected from multiple places. Functional teams repeatedly prepared Excel files, and market or shop-floor information was not reported consistently enough for management review.
Sales, receivables, and inventory questions crossed company, customer, salesperson, warehouse, and material dimensions. The team needed detailed operational reporting as well as management analysis, without putting analytical load or write-back risk on the ERP.
Selected customer and partner marks from existing corporate materials, spanning manufacturing, energy, infrastructure, healthcare and group enterprises.






























Logos are displayed for organizational identification; trademarks remain the property of their respective owners.
Two appreciation letters from completed BI engagements. Open either document to inspect the original Chinese wording instead of relying on rewritten performance claims.
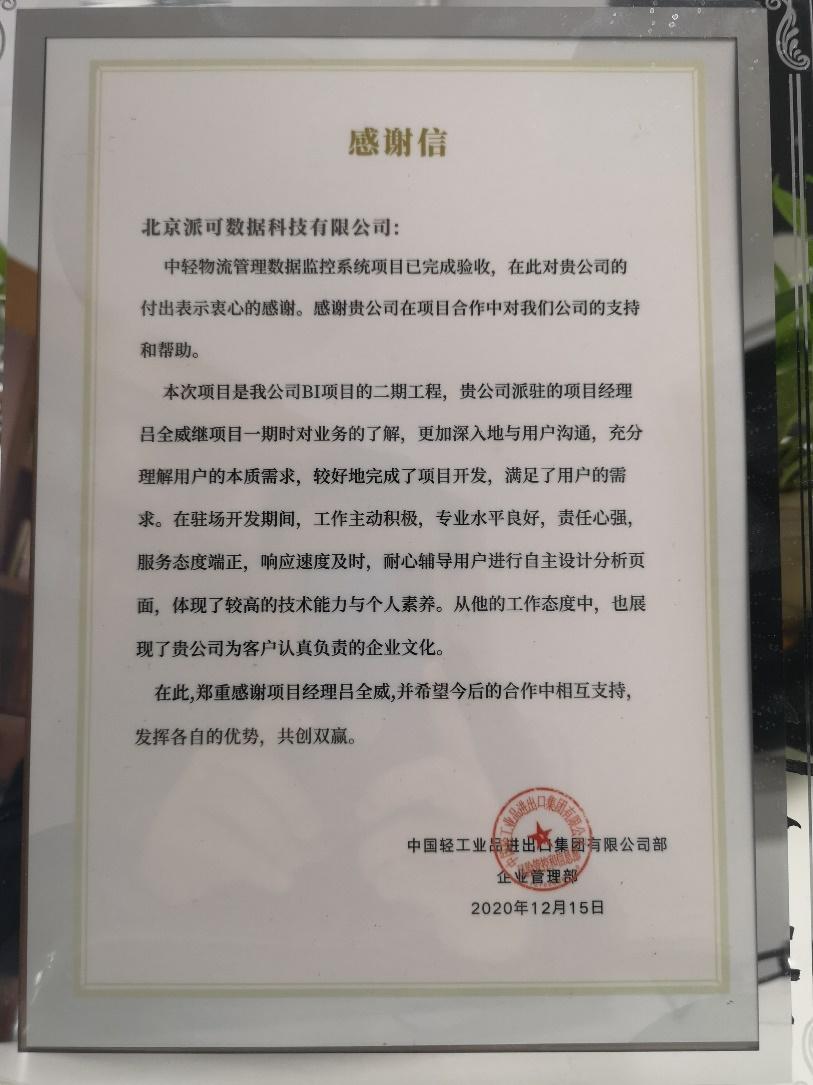

Software rights, partner authorizations, management certification and industry memberships supplied in the company knowledge materials.
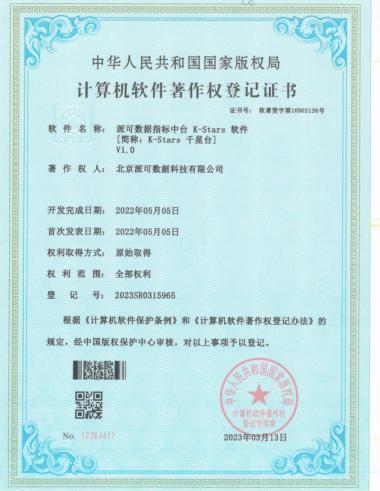


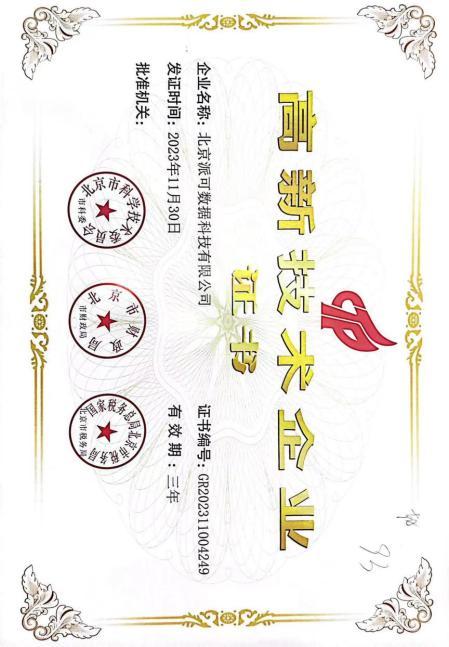
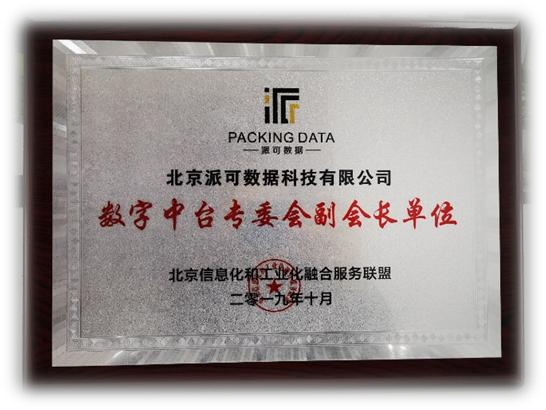
.jpg)


Scroll horizontally to review all credentials.
Start with shared business keys, a consistent data grain, and one governed definition for every operational KPI.
Tell us what is fragmented today. We’ll map the data, decision and deployment path for your team.
Straight answers based on the current PACK BI product knowledge base.
Yes. Current product materials document private deployment for single organizations and multi-entity groups. The final architecture and capacity plan should be assessed against your data volume, concurrency, database and availability requirements.
Documented sources include Oracle, MySQL, SQL Server, PostgreSQL, Hive, Vertica, ClickHouse, text files and third-party APIs. Existing solution materials also cover integration patterns around ERP, MES, OA and manually collected data.
Usually, yes. PACK BI is positioned as an analytical layer around existing operational systems. It can centralize models and KPI logic while supporting interactive dashboards, structured reports and controlled data collection. Fit still depends on the specific ERP version and report design.
The strongest fit is a manufacturer, multi-entity group or ERP/solution partner facing cross-system reporting, inconsistent KPI definitions, complex operational reports or spreadsheet-based data collection — especially when private deployment matters.